
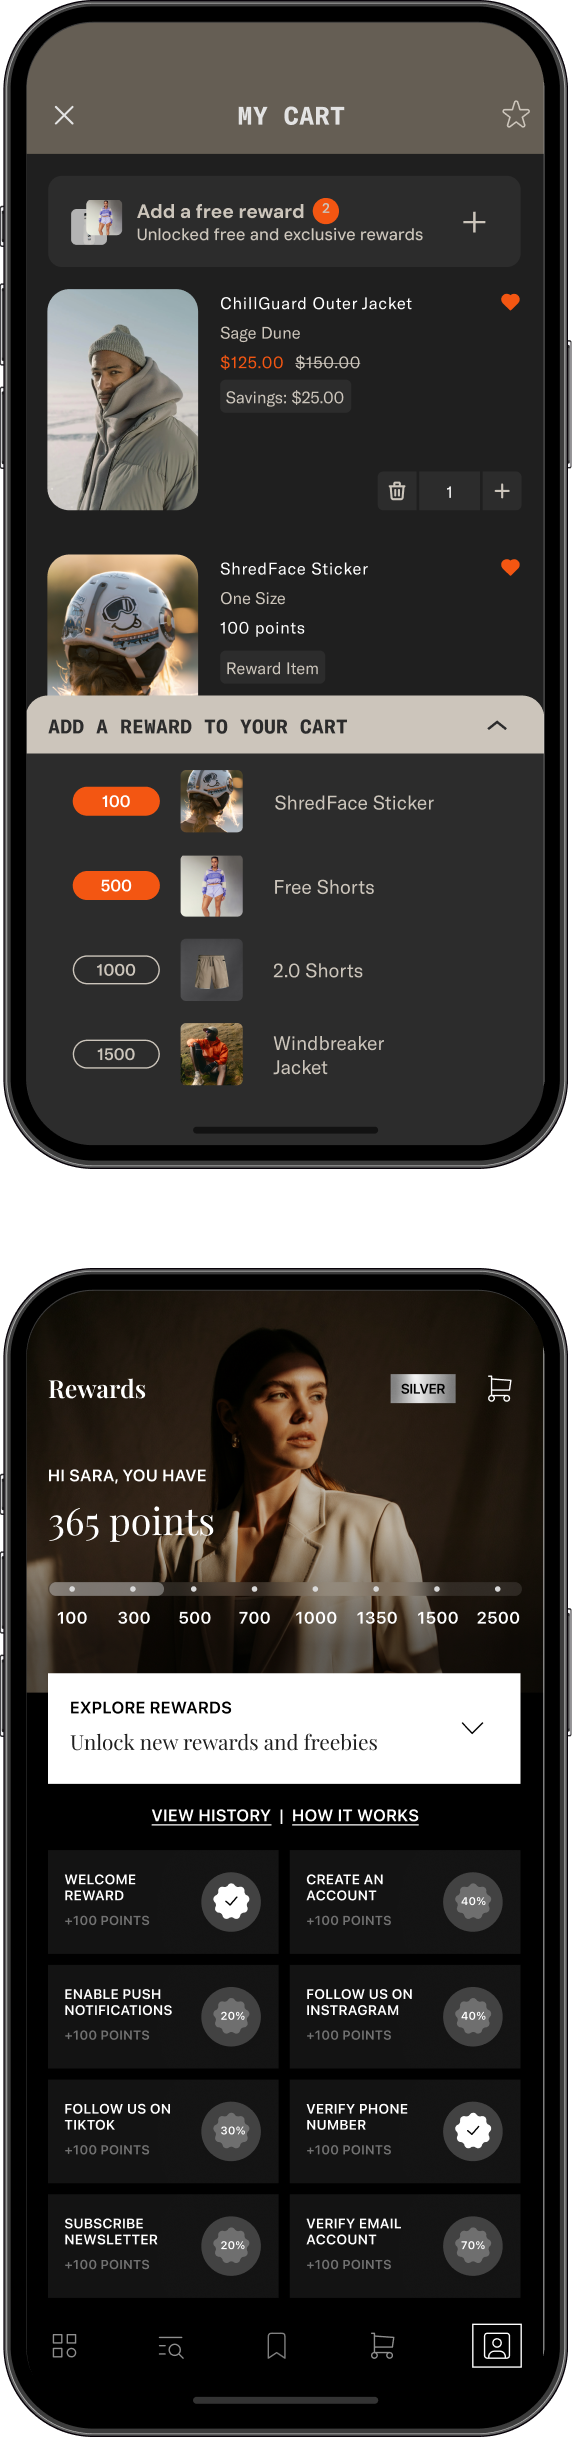
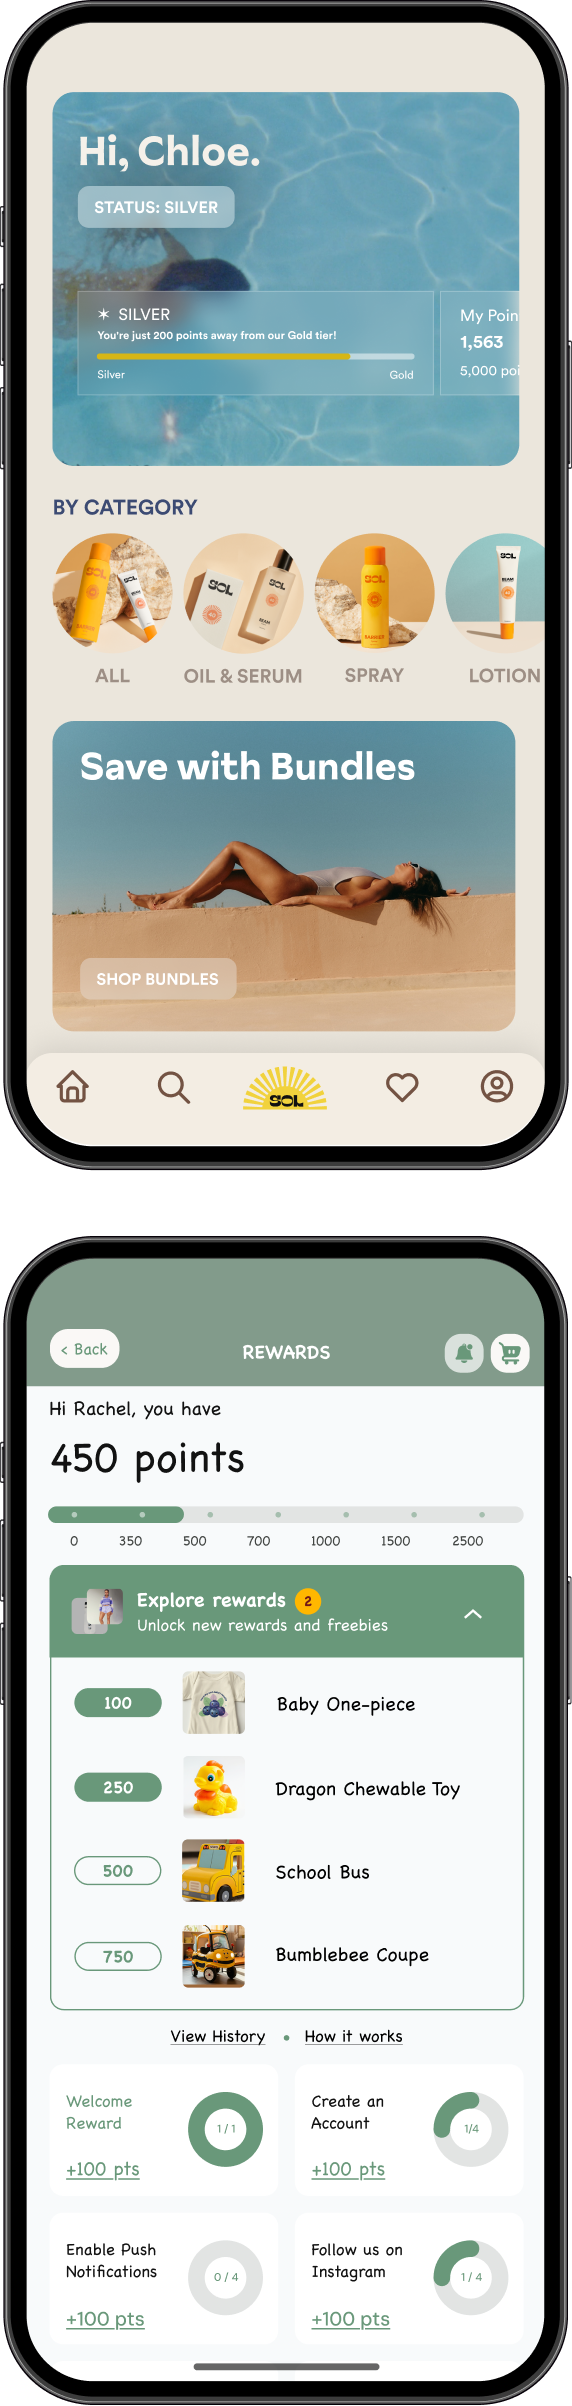
Your New Loyalty HQ

Bring loyalty front-and-center in your mobile app to turn your shoppers into super fans.


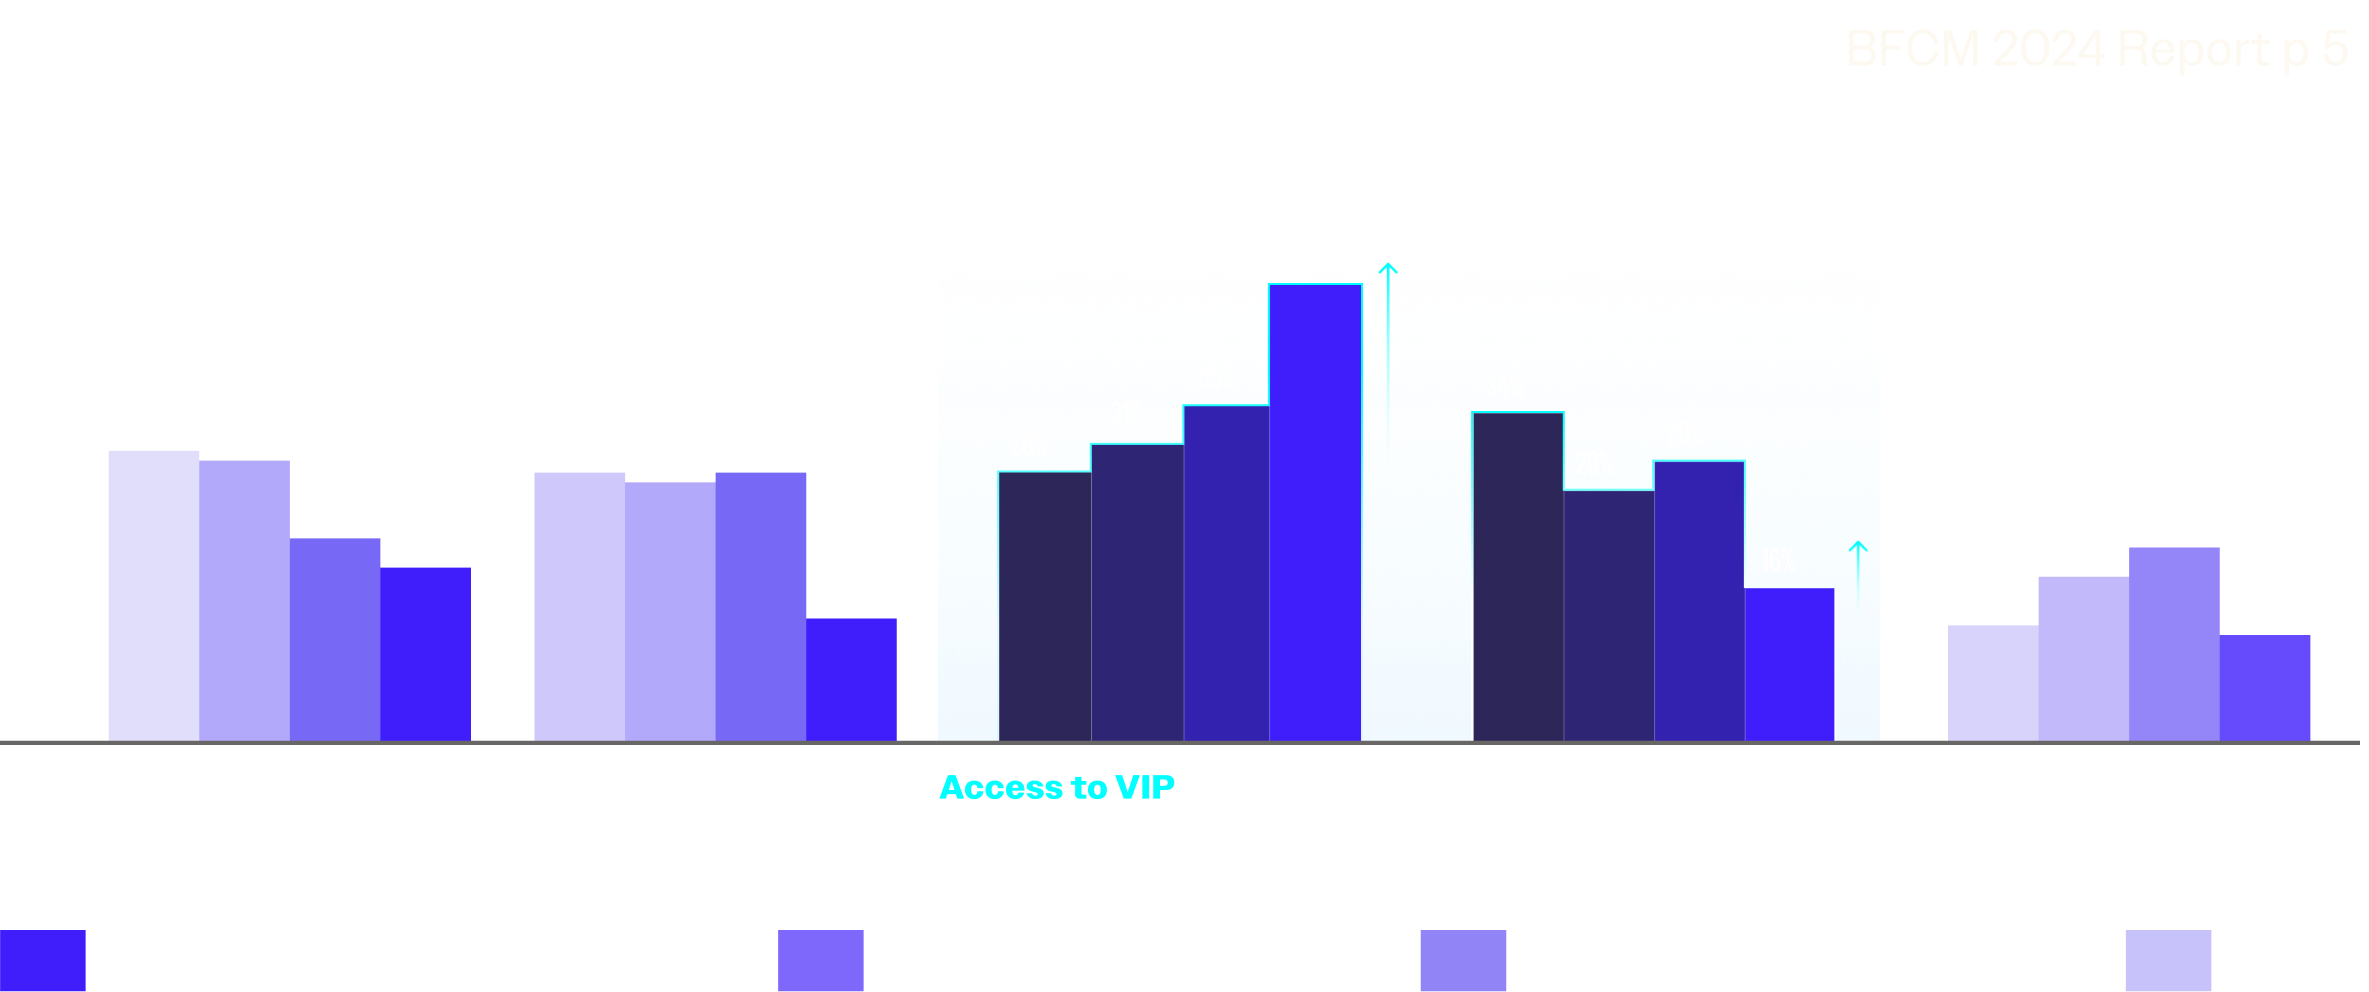
Align your loyalty strategy with your audience
Breaking down the demographic composition of your audience.


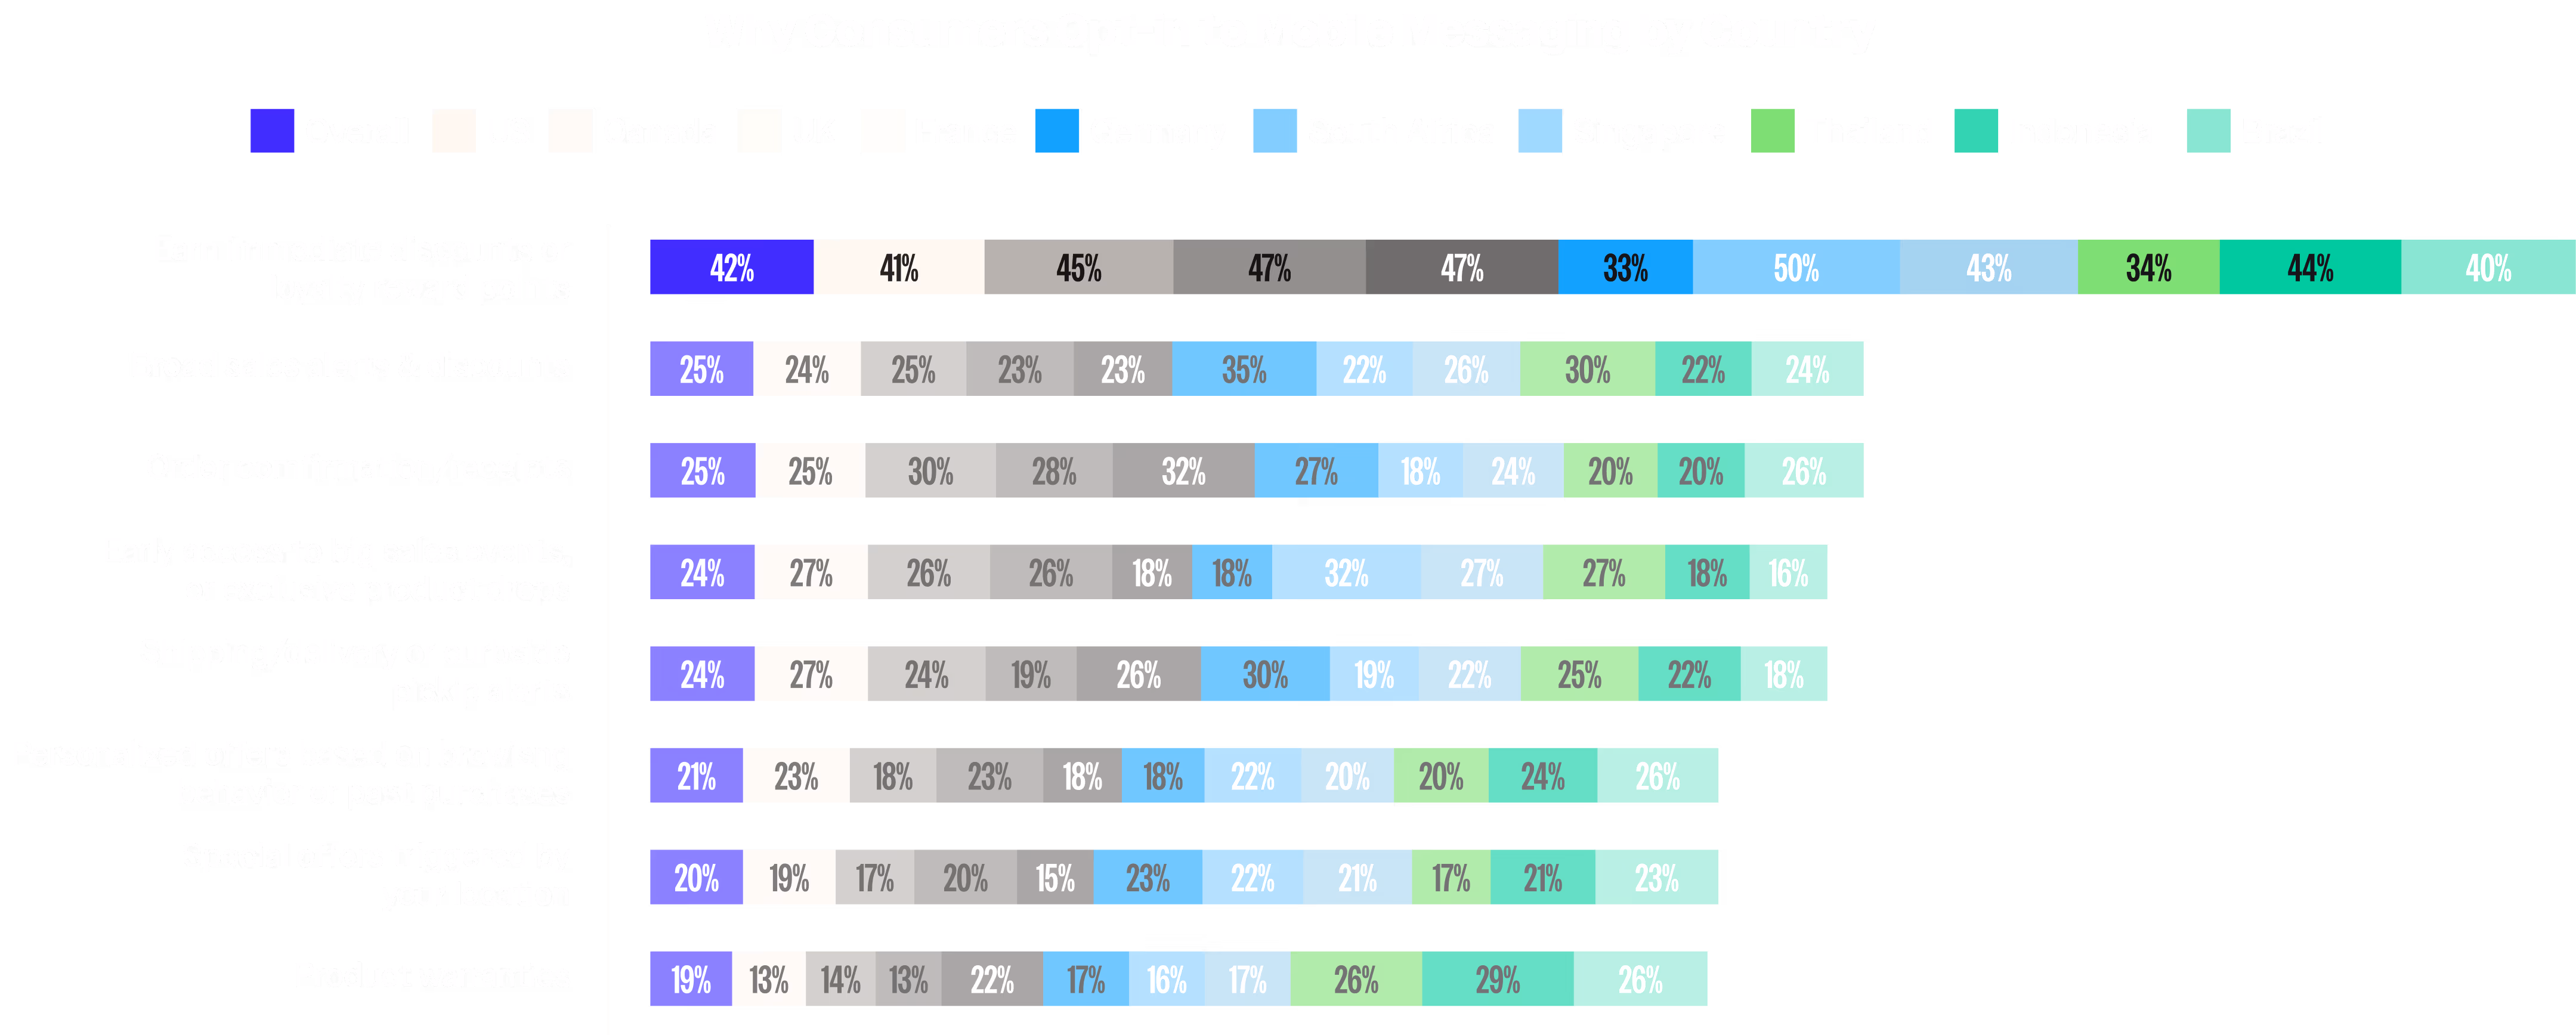


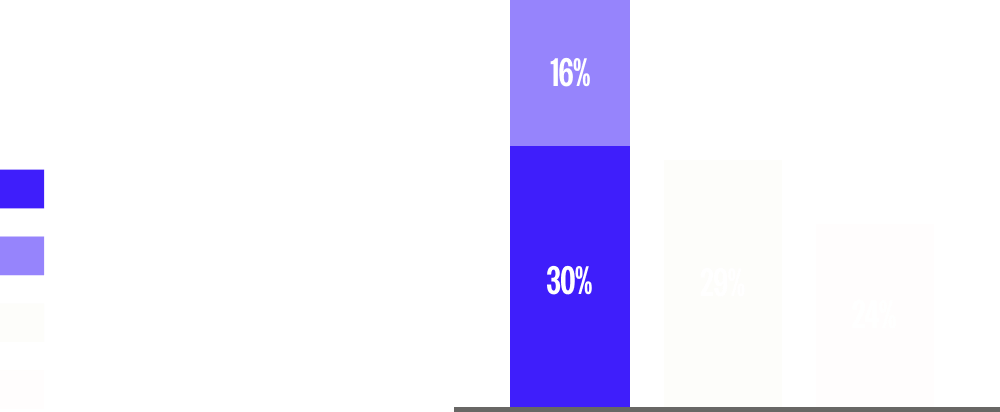
What aspect(s) about shopping with a mobile app do you like the most?


The mobile platform behind your brand’s growth. Build apps that engage, convert, and scale—on your terms.
The mobile platform behind your brand’s growth. Build apps that engage, convert, and scale—on your terms.
What’s the bottom line impact?


+
$5.92m
Maximize your revenue position
We modeled your current state with site data from Similarweb, and the CVR & AOV from Shopify analytics averages in your industry. You can update these if they are not correct. The model will respond.


After launching an app, the average merchant in this sample:
Breaking down the demographic composition of your audience.
“Push is an incremental opportunity for additional revenue. Once a customer downloads the app, we can guarantee the trigger will fire—it’s a more reliable way to push marketing communications.”
142%
higher conversion rate in the U.S. app vs. mobile web
35%
increase in AOV for app users


Senior Ecommerce Manager


