


When you put a new channel in front of leadership, the debate always comes down to three gates: is it incremental, is it material, and is it durable?
This analysis is built to clear those gates. Backed by 330M orders, 120M shoppers, and $31.5B in measured revenue, it shows with certainty that mobile apps don’t just shift spend between surfaces—they generate new, lasting revenue streams that move the topline at enterprise scale.
Every outcome presented here reflects platform versions 0–19 (pre Tapcart v20). That baseline gives us a stable, credible foundation to evaluate what’s material today and where execution can raise the ceiling tomorrow.
The purpose of what follows is straightforward: surface the signals in this data that matter for executive decisions, so your team can plan with confidence and present a business case that stands up in the boardroom.
1) Let’s Start With the Real Questions
If you’re responsible for ecommerce growth at a leading Shopify brand, you don’t need more hype. You need results that hold up under CFO review and give your board confidence in the path forward.
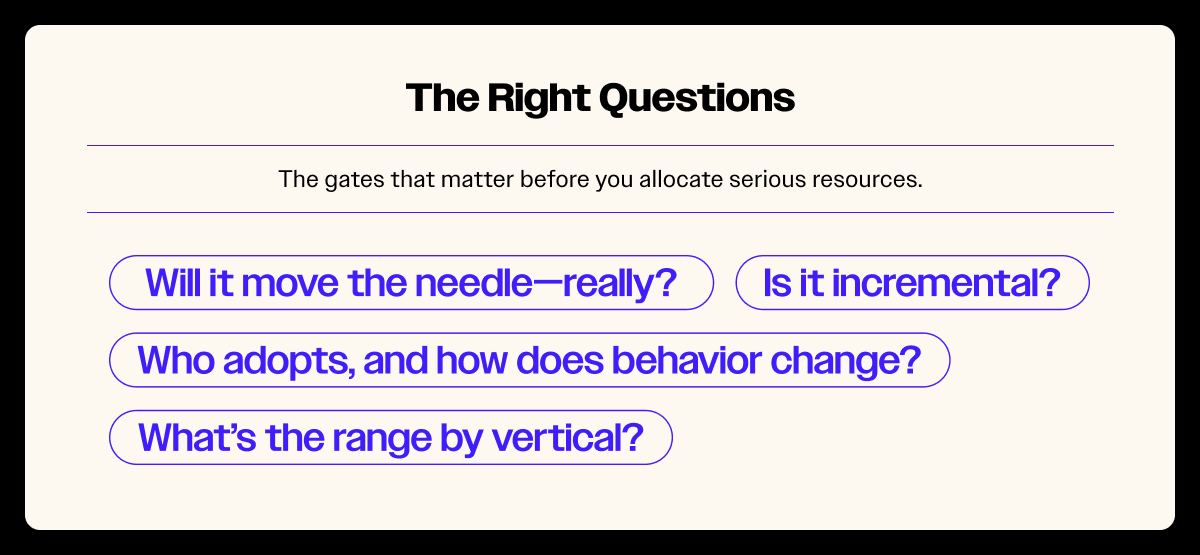
The questions I hear most—often from the same leaders who ultimately green-light this channel—are the right ones:
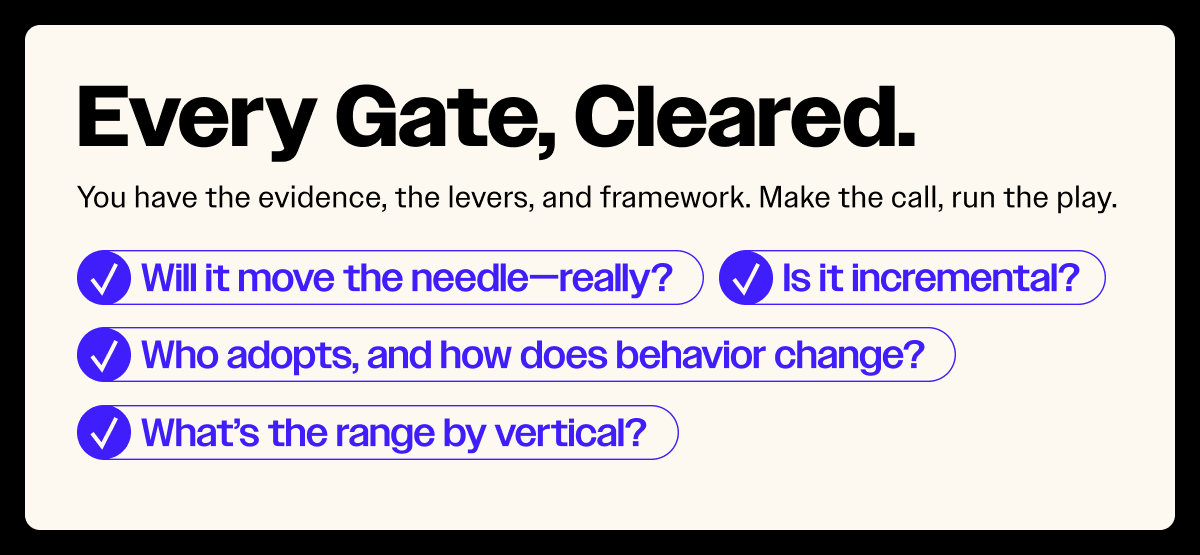
- Will this move the needle in absolute dollars at our scale?
- Is the growth incremental, or just a shift in attribution that looks good on a dashboard but nets out flat in a ledger?
- How many customers will actually adopt the app, and how does that adoption change their buying behavior?
- Where do the averages land, what does the distribution look like by vertical, and is the variance predictable enough to plan against?
- What’s the near-term floor we can responsibly forecast, and what does “good” look like with disciplined execution?
Those are the gates. They’re not unique to mobile apps, this is how strong revenue leaders evaluate any relevant channel addition. Cross them, and the channel earns strategic attention. Miss them, and it stays a nice idea buried in slide 18 of a deck.
2) The Baseline: What Happens on Average
When you put a new channel in front of your CFO, the first hurdle isn’t edge cases—it’s the average. At scale, averages matter because they define the floor: the number you can safely build into a forecast before debating variance.
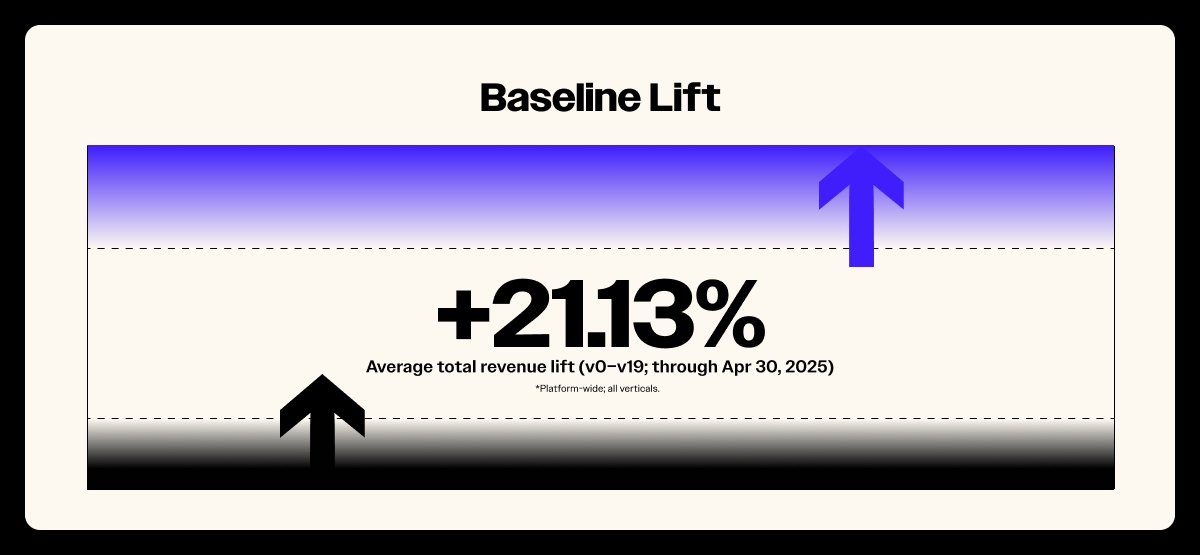
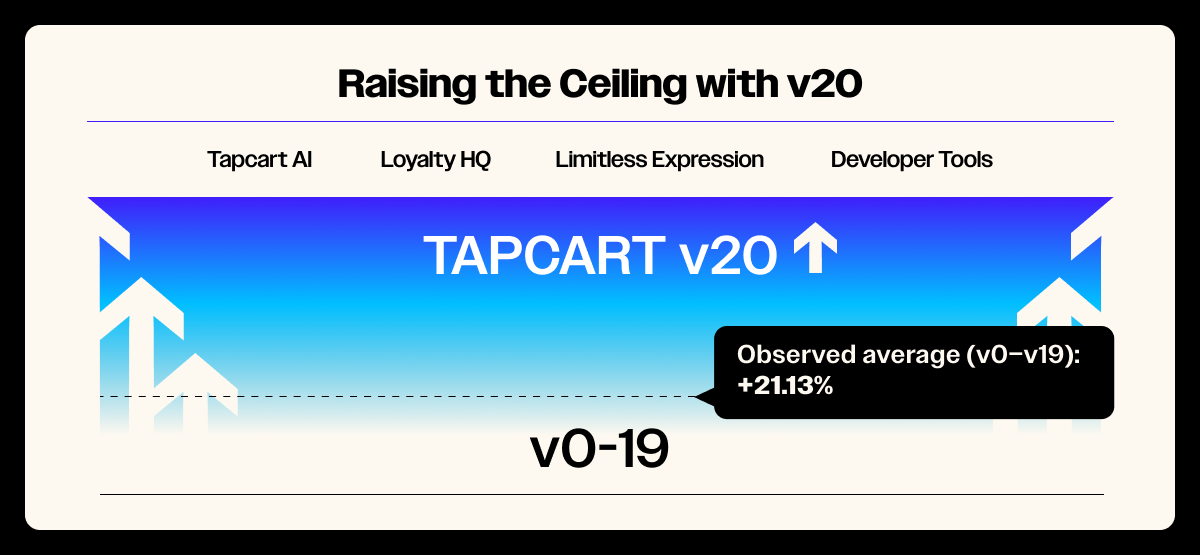
Across all brands and verticals in the dataset, measured through April 30, 2025, the average total revenue lift associated with launching the mobile app channel is +21.13%.
Two clarifications matter here:
- This is an average across the full distribution, not a cherry-picked case study. Some brands land above, others below; but +21.13% is the gravitational center.
- This reflects pre-v20 performance. Everything here was achieved on versions 0–19. Improvements in App Studio, analytics, and adoption tooling introduced with v20 are not reflected in the baseline.
For planning purposes, the math is straightforward:
- At $20M topline, +21.13% equates to ~$4.23M in incremental revenue.
- At $50M, it’s ~$10.56M.
- At $100M, it’s ~$21.13M.
No single metric decides a multi-million-dollar decision, but +21% is the kind of baseline that clears the board’s materiality bar. Because this dataset spans years, verticals, and market conditions, it reflects more than a temporary bump—it reflects a durable shift in how customers behave once they adopt an app channel.
The mechanics behind that shift follow in Sections 3-4. For now, the baseline answers the first and most important checkpoint: is this material at enterprise scale? The data says yes.
3) Incrementality: Proof It’s Net-New Growth
Incrementality decides whether this is strategy or theater. If the app simply moves web orders into a new container, it doesn’t matter how polished the interface is. If per-customer revenue rises once the app enters the relationship, you have a true growth engine. The cohort data answers this cleanly.
Method, briefly. We segmented shoppers by where they started (web vs. app). We then observe per-shopper total spend before and after an app enters the relationship. This removes attribution noise and centers the only metric that matters to finance and marketing leaders alike: “Do customers buy more from us when two surfaces exist?”
What the cohorts show:
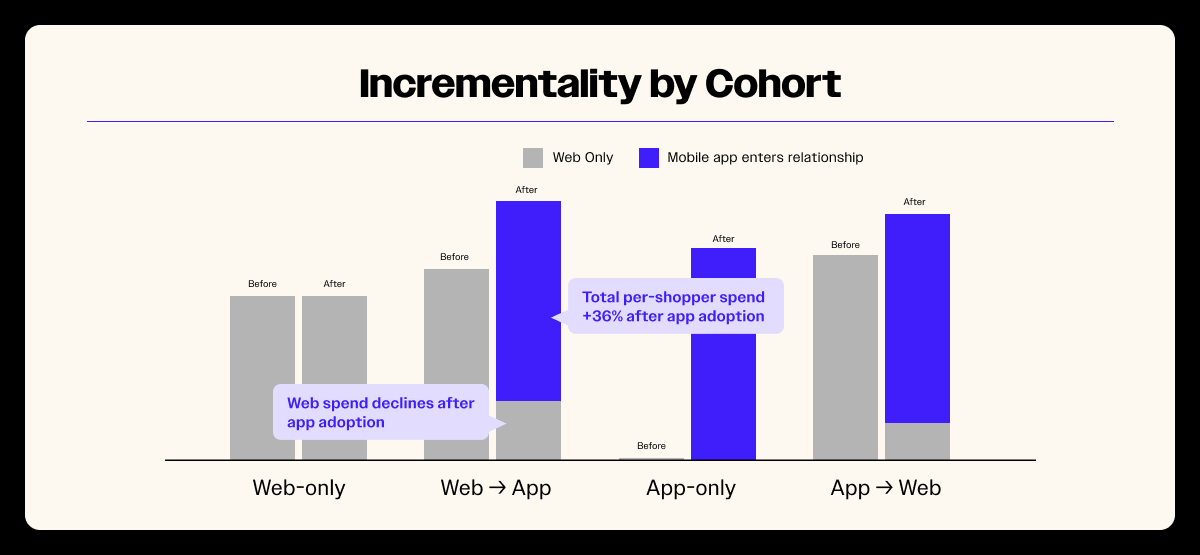
- Web-first, Web-only. Continue buying exclusively on the website. Spend trajectory is steady; this is the control.
- Web → App. Begin on web, later adopt the app. Web spend declines (channel shift); app spend rises from zero; total per-shopper spend increases by ~36% once both surfaces are in play. The pie grows.
- App-first, App-only. Receipts exist only in the app—net-new relative to a web-only world. Their presence proves the app captures customers who otherwise would not transact.
- App-first, Web-also. Begin in app, later purchase on web. When both surfaces exist, purchase opportunities expand; frequency rises; per-customer totals lift over time.
Why the pie grows (the mechanics)
- Friction removal. The app lives on the home screen, remembers the shopper, and shortens path-to-purchase (biometrics, stored payment, persistent cart, wishlist memory). “I might buy later” turns into “I just did.”
- An additional engagement surface. Push does not replace email or SMS; it adds a third, high-signal channel with zero marginal reach cost. Timed against inventory events, price moves, or drop windows, it drives frequency—the heartbeat of LTV.
Independent benchmarks support this: brands using mobile push see average sessions up ~182% and purchases per user up ~116% when the channel is executed well—exactly the kind of second “heartbeat” our cohorts show. (Braze)
- Value architecture. When early access, exclusives, and VIP perks reliably live in the app first, customers learn the pattern: “check the app.” That intentional check-in behavior compounds into habit.
How to measure incrementality inside your brand
- Instrument cohorts, not just channels. Segment by first surface and compare per-shopper totals six to twelve months before app adoption vs six to twelve months after. Resist the temptation to read one-month deltas; behavior needs time to stabilize.
- Build the two-by-two. Web-only; Web→App; App-only; App→Web. This prevents the “app stole our orders” narrative from obscuring the important fact: total customer value rises when two surfaces exist.
- Report three lines, consistently:
- Per-shopper total spend by cohort (before vs. after).
- Order frequency by cohort (before vs. after).
- App adoption rate (% of active customers using the app monthly)
Together, these lines explain the outcomes leadership cares about most.
Questions Your Leadership Team Will Ask
- “Aren’t you just cannibalizing web?”
At the channel level, some cannibalization is visible. At the customer level, the pie expands. The Web→App cohort alone shows ~36% growth with the second surface live. - “Couldn’t those customers have grown anyway?”
Possible, and that’s why you want the counterfactual cohort: App-only. Those receipts don’t exist in your web-only world. You can’t attribute them to “growth that would have happened.” You can attribute them to “a surface they prefer that now exists.” - “Isn’t this just a vanity play? Another surface to manage?”
If the data showed flat totals, I’d agree. But with +21.13% average lift across the platform and clear cohort-level increases, this isn’t cosmetic. It’s a measurable driver of incremental revenue that scales with topline. - “Is this just inflating revenue credit from push notifications?”
Push isn’t a trick—it’s a structural advantage. Unlike email or SMS, push is free and unlimited. Every time you send one, you’re reaching customers at zero marginal cost. If orders-per-customer rise alongside push adoption, that’s not over-attribution—it’s the economics of a channel that compounds value without compounding spend.
4) Where Relationships Start: App-First Customers as an Acquisition Lever
One finding often catches teams off guard (and it may surprise you): a meaningful share of customers begin their relationship in the app. Not “download after three purchases.” First receipt in the app.
Across the platform dataset, approximately 11.2% of customers land in this app-first slice. The exact percentage varies by vertical and execution, but the pattern is consistent enough to use as a planning assumption: some shoppers prefer apps, and if you don’t offer that surface, they transact with someone else who does.
What drives app-first acquisition?
- Preference, not novelty. For a durable segment, shopping lives in apps. They expect speed, remembered state, and trusted payments. They habitually check the brands they care about inside containers that feel personal.
- Value placement. When the best moments happen in-app first—early access, limited capsules, loyalty unlocks—the path of least resistance to the thing they want runs through the app. That’s not a trick; it’s a rational response to where value lives.
- Acquisition paths that end in-app. Social and creator campaigns can deep link to “download for early access.” Onsite CTAs can articulate a reason to install beyond “get our app.” Post-purchase flows can guide new buyers into the app, where second orders happen fastest.
Why app-first matters strategically
- Top-of-funnel expansion you’d otherwise miss. If app-first customers wouldn’t transact on mobile web, then the app isn’t just shifting where they buy; it’s creating first purchases. At scale, that is the difference between net-new customers in your file and net-new customers in a competitor’s.
- A stronger starting point for LTV. App-first shoppers begin inside the container where frequency and conversion are strongest. That matters in the first 2–3 orders where churn risk is highest—each extra relevant nudge increases the odds you exit the “trial” phase with a subscriber-like habit.
- More efficient unit economics. App-first customers are acquired directly into a channel with free engagement. Every push notification costs nothing to send. The result is that the cost to activate, retain, and grow app-first cohorts is structurally lower. When you compare CAC-to-LTV ratios, the math tilts heavily in favor of customers who start in the app—because the long tail of retention doesn’t require incremental spend to keep them buying. This is leverage to make your MER (marketing efficiency ratio) performance the best it’s ever been.
How to operationalize app-first without gimmicks
- Lead with explicit value. Replace generic CTAs like “Download our app” with “Get early access to Thursday’s drop,” “Reserve your size before public release,” or “Unlock app-only exclusives.” Clear value articulation is the single strongest driver of adoption.
- Position the app as your Loyalty HQ. Leading brands centralize loyalty benefits in-app: VIP tiers, point tracking, unlockable rewards, and referral perks. This shifts the app from “another surface” to the control center for ongoing value, creating habitual check-ins and extending customer lifetime value.
- Sequence channels. Use email and SMS to promote your app and drive downloads (allocate as little as 1-2 dedicated sends). Push notifications are free and unlimited, so grow that subscriber list as large as possible as fast as possible. The SMS and email mediums are great to accelerate that.
- Design a week-one experience. Treat the first seven days like onboarding a paid subscriber: welcome screen that restates value; follow with one highly relevant push; surface a simple action (e.g., wishlist, size profile) that sets up the next relevant push. Don’t firehose; orchestrate.
- Measure the right things. Focus on signals that show adoption is compounding: more first purchases happening in-app, stronger early retention, and faster movement from first to repeat order. The specifics will differ by brand, but the principle is the same—measure whether the app is pulling customers deeper into relationship, not just shifting where orders land.
A Simple Mental Model for Leadership
If your brand adds 20,000 new customers this year and 11.2% begin in the app, that’s ~2,200 customers you likely would not have captured on mobile web.
Over three years, that’s ~7,500 net-new customers starting inside your best retention surface. Multiply by even a modest LTV lifts and the revenue impact becomes self-evident: this isn’t just an engagement channel, it’s a growth lever that changes the unit economics of your file.

5) Why Now
Timing is a strategy choice, not a scheduling one. When a board or leadership team considers a new channel, the right question isn’t “do we want this?” It’s: “When does waiting stop being neutral?”
The data points to three clear realities:
1. Preference already exists. Roughly one in eight shoppers already behave as if shopping “lives in apps.” They don’t transact in other channels. That preference isn’t speculative; it’s visible in the receipts. These customers are not waiting to be convinced; they’re already signaling how they want to shop. Brands that meet that demand earn adoption without friction. Brands that don’t risk losing those shoppers to competitors who do.
And this signal isn’t just in Tapcart’s dataset. eMarketer reports that more than half of adults worldwide (52%) have purchased through a mobile app — and by 2025, two-thirds of U.S. smartphone users will shop with retail apps.
In other words: consumer preference has already shifted, and the curve is steepening.
2. Adoption compounds to a competitor’s advantage. Once a shopper adopts a competitor’s app, that brand gains two things:
- A zero-marginal-cost reach channel (push notifications vs. paid impressions).
- A permanent seat on the home screen.
Every reminder after that is free, and every interaction compounds the habit. Home screen real estate is scarce; once secured, it is not easily dislodged. Waiting doesn’t just delay your own growth, it entrenches someone else’s.
3. The cost of delay is asymmetric. With a +21.13% historical average lift, a 12-month delay equals a year of incremental revenue you cannot recapture. For a $50M brand, that’s ≈ $10M left on the table. For a $100M brand, ≈ $21M. And in that same year, a competitor compounds LTV by retaining segments you could have owned. Reacquisition later requires buying back customers through higher-cost channels like paid media or SMS. By definition, that is more expensive and less efficient than retaining them inside the app container from the start.
Taken together, these dynamics make the timing choice clear. The prudent posture is not urgency for urgency’s sake, but alignment with existing consumer behavior—and recognition that waiting is not neutral. Each month of delay transfers value to competitors who are already compounding adoption.
See what you’re leaving on the table.

6) The Range of Outcomes by Vertical
Averages define the floor. Ranges define the planning envelope. When we slice the dataset by vertical (still pre-v20, through April 30, 2025), the average lifts look like this:
- Fashion & Apparel — +23.97%
- Other — +23.44%
- Beauty & Cosmetics — +21.31%
- Food & Beverage — +16.36%
- Home & Hobby — +11.66%
- Health & Wellness — +9.82%
Two takeaways:
- The low end is still material. +9–12% at scale is meaningful. The floor clears most finance teams’ “is this worth it?” bar. For a $50M brand in Health & Wellness, +9.82% equals nearly $5M in incremental revenue. At that level, “floor” isn’t failure; it's a meaningful contribution.
- Most categories cluster in the +16–24% band. That band is where execution explains variance: offer compelling reasons to join, promote them everywhere, and disciplined lifecycle management—brands who do those three reliably show up near the top.
What explains differences between categories?
- Merch cadence & novelty. Apparel and Beauty launch more frequently, making “early access” and “drop windows” natural. That creates more moments to justify a check-the-app behavior. Health & Wellness and Home may see fewer event-driven spikes, so their performance leans on lifecycle mechanics like replenishment nudges or value-add content.
- Purchase frequency & triggers. Food & Beverage has natural weekly rhythms, making push a natural fit for “restock” or “today’s menu.” Home & Hobby often operates on longer cycles, where success leans on content and project-based journeys (e.g., checklists, how-tos) and inventory signals (back-in-stock for long-tail SKUs).
- Identity & community. Categories tied to self-expression—style tribes in Apparel, subcultures in Beauty—see outsized returns when the app frames membership as belonging and access, with badges, exclusives, or creator-led capsules.
- Subscription effect. For Food & Bev and Health & Wellness in particular, the revenue attribution around subscription programs is also a material factor. In subscription settings, we see significant shopper-side impact from mobile apps manifesting in merchant-side revenue that is ultimately attributed to the “subscription” channel.
How to Plan with the Range
Start with your vertical’s average from the list above. That’s your baseline—the number you can take into a planning conversation with finance or your board.
From there, think in three tiers:
- Conservative floor. Assume outcomes near the low end of your vertical (+9–12%). This is what you can plan against responsibly, even with modest adoption.
- Baseline (most likely). Use your category’s average as the central case (+16–21% for most categories). This is the outcome most brands see with steady execution.
- Stretch. Treat the upper band (+23–24+%) as what disciplined adoption programs and ongoing app programming can achieve.
Execution is what determines where you land within that envelope:
- Clear reasons to join (early access, exclusives, loyalty unlocks).
- Promotion across every channel (onsite CTAs, lifecycle-SMS & email, paid).
- Consistent programming (drops, replenishment nudges, VIP moments, etc).
The numbers tell you the opportunity is real; execution determines how much of it you capture. Even the floor delivers meaningful growth, but the spread between the low end and the high end is where discipline separates winners from laggards.
Which raises the critical question: if the range is credible, how do you get to the high end of it? That’s where we turn next.

7) How to Get to the High End of Your Range
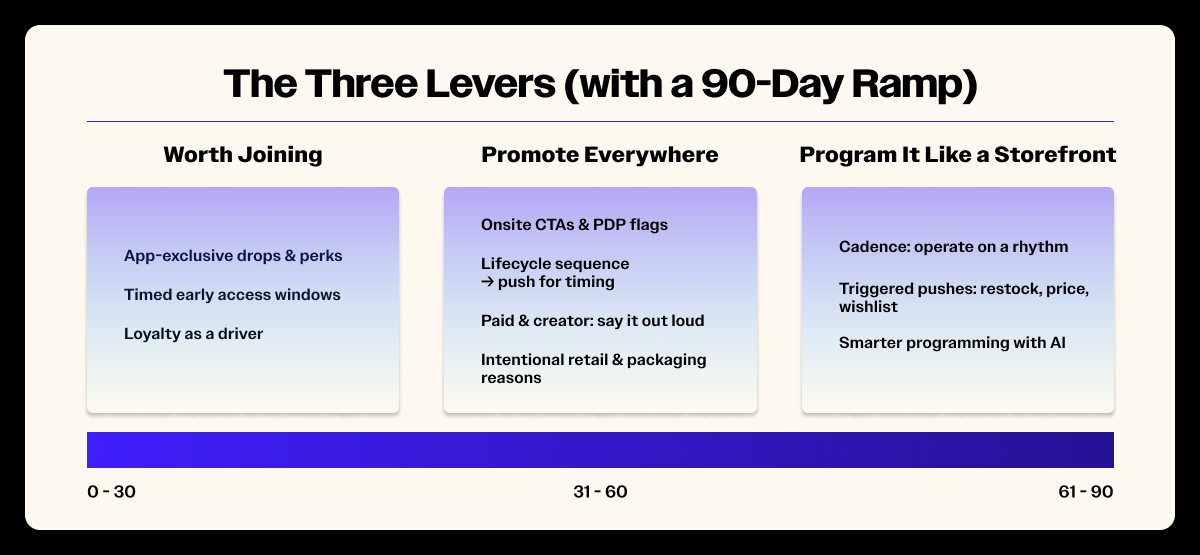
You now know the floor, the average, and the ceiling for your vertical. Where you land inside that band isn’t luck–it’s execution. Brands at the high end don’t improvise; they operationalize four moves with discipline. Each of these has been validated across hundreds of implementations and is consistent with the best practices our Customer Success team deploys every day.
1. Give customers a reason to join. A banner isn’t enough. Adoption only happens when the value is explicit and durable.
- App-first value moments. Early access, capsule drops, and app-only variants give customers tangible reasons to download and return. The moment of value lives in the app—not in an email archive.
- Loyalty as a driver. With v20’s Loyalty HQ—points, perks, and rewards are visible in-app. That shift turns loyalty from a background program into a front-of-mind reason to shop where benefits live.
This is consistent with enterprise research showing integrated loyalty—visible, easy to use, and tied to real value—drives measurable gains in retention and revenue.
Signal to monitor: % of customers making first purchase in-app; day-7 retention of app-first vs. web-first customers; days-to-second-order by acquisition surface.
2. Promote it everywhere. Adoption isn’t a side project; it’s a KPI. Every surface should point to the app.
- Onsite prompts. Persistent header/footer CTAs, PDP ribbons for in-app exclusives, and post-purchase flows that explain the why behind downloading.
- Lifecycle orchestration. Use email/SMS to frame the benefit; let push deliver the moment.
- Paid & creator. Don’t bury the hook: say “Thursday’s drop is app-only” in ads and let creators dramatize the unlock.
- Retail & packaging. QR codes in-store or on packaging should connect to a reason—not just “get our app,” but “reserve your size before public release.”
Signal to monitor: App adoption rate; push opt-in rate; percentage of active customers using the app monthly.
3. Program it like a storefront. Static apps decay; programmed apps compound. Brands that sustain growth treat the app like a living, breathing flagship–fresh each week, designed to reward habitual check-ins.
- Cadence. Operate on a rhythm: drops, restocks, live edits, and editorial content. A consistent pulse trains customers to expect something new every time they open the app.
- Event-driven pushes. Inventory and price are the strongest natural triggers. Layer in wishlists, size profiles, and back-in-stock alerts to make them personal.
- Smarter programming with AI. Tapcart’s AI capabilities can recommend optimal timing for pushes, surface patterns in customer behavior, and even suggest fresh content moments. The result: sharper programming decisions and fewer missed opportunities.
Signal to monitor: Returning-user rate; push-driven revenue; time-to-second-order.
4. Personalize to deepen engagement.
The goal is for shoppers to feel like the app is designed specifically for them, not just a static, generic storefront. AI is the lever that makes this level of personalization scalable and effortless. AI is the lever to make this a reality.
- Offers that feel individually relevant. Instead of broad discounts or generic promotions, AI enables operators to surface the right offer at the right time, matched to individual intent signals. The shopper feels like the brand anticipated their need, and operators see deeper engagement with less guesswork.
- Trigger at the right moment. Push notifications and nudges are triggered when a shopper is most receptive, balancing frequency with precision so messages land as welcome reminders rather than noise.
- Feeds that feel personal. Shopping shouldn’t feel static. AI makes it possible to deliver a dynamic, “for you” feed that blends content, product, and offers in a way that feels as engaging as a social platform but converts like a storefront. This kind of personalization turns browsing into habit and habit into higher LTV.
Signal to monitor: Triggered revenue; repeat purchase rate; LTV lift by cohort.
How to Resource and Govern
Execution at this level requires clarity of ownership. The most successful brands structure governance around:
- One accountable owner. Someone who owns the app calendar, not “whoever has time.”
- Cross-functional triad. Close alignment between lifecycle, merchandising, and creative ensures the app stays programmed with purpose.
- 90-day incentive ramp. Instead of aiming for perfection out of the gate, the strongest brands build momentum in phases:
- First 30 days: Establish core reasons to join (exclusives, early access, loyalty unlocks) and stand up your foundational push cadences.
- Days 31–60: Introduce at least one recurring program–whether weekly newness, replenishment nudges, or editorial storytelling–that trains customers to check the app.
- Days 61–90: Layer in your first app-only moment (e.g., capsule, drop, or gated loyalty perk) and begin reporting simple cohort outcomes to leadership.
- First 30 days: Establish core reasons to join (exclusives, early access, loyalty unlocks) and stand up your foundational push cadences.
KPIs to run the business on: adoption rate; first-purchase-in-app share; per-shopper totals by cohort; push-driven revenue; days-to-second-order.
8) Expanding the Operating Frontier with v20
Everything up to this point—+21.13% baseline lift, cohort-level incrementality, app-first acquisition, and vertical ranges—was achieved on versions 0–19. That context matters. It lets us talk about v20 responsibly: not as a speculative promise of “X% more revenue”, but as an expansion of the levers operators can now pull to reach the high end of their range with more consistency.
Each of these v20 pillars connects a new capability to a practical operator move, with a KPI signal that makes the impact visible to leadership:
AI
In v20, AI isn’t about buzzwords or distant promises—it’s about practical levers that help brands drive precision and efficiency every day. AI reduces the guesswork and multiplies the impact of each action, turning personalization into a habit-forming, compounding advantage.
This shift is already visible. According to Salesforce, AI-influenced shopping drove $229B—or 19% of global online orders—during the 2024 holiday season. What once felt experimental is now material at scale, and v20 puts those levers directly into operators’ hands.
- Smarter timing and delivery. when to send, AI analyzes shopper behavior to recommend the right windows for engagement. Messages arrive when they’re most likely to be noticed, turning push into a dependable driver of return traffic and revenue.
The KPI signal: higher push-driven revenue per send, reduced opt-out rates, and more efficient campaign performance.
- Automation that scales with you. AI takes on the heavy lifting of segmentation and message tailoring—suggesting audience splits, drafting variations, and surfacing predictive triggers. Teams stop choosing between relevance and bandwidth; they get both.
The KPI signal: more campaigns launched, higher per-campaign performance, and broader use of advanced tactics by leaner teams.
- Personalization that builds habits. The long-term direction is personalization so seamless that every session feels individually relevant and habit-forming. AI helps brands deliver this without adding manual complexity—ensuring engagement feels natural, not forced.
Loyalty HQ
Mobile apps are becoming the headquarters for loyalty. v20 brings loyalty mechanics directly into the most engaged channel.
- Loyalty in plain sight. With Loyalty HQ, points, perks, and redemption options are fully visible inside the app. Shoppers no longer need to dig through emails or log into a web portal to see their status. For operators, this shifts loyalty from a background program to a front-of-mind engagement engine.
The KPI signal: higher loyalty participation rates, stronger repeat purchase share, and steeper retention curves as customers are nudged to shop where their benefits live.
- Habit-forming rewards. When early access, VIP perks, or members-only drops are gated inside the app, customers learn to start every purchase journey there. This isn’t about gimmicks; it’s about making value predictable.
The KPI signal: higher app open rates during key launches, faster sell-through of exclusives, and widening LTV gaps between loyalty members and non-members.
Limitless Expression
v20 equips brands with deeper creative control so the app feels like a true extension of the brand, not a generic container.
- Faster merchandising cycles. With flexible layouts and reusable blocks, teams can launch campaign pages, capsules, or editorial features in hours instead of weeks. That speed keeps content fresh and reactive to what’s happening in culture.
The KPI signal: faster time-to-live, sustained returning-user rates, and fewer “stale content” drop-offs.
- Creative parity with brand systems. When app components match the brand’s web and editorial style, the experience feels consistent across surfaces. Shoppers convert at higher rates when the app carries the same design authority as the storefront.
The KPI signal: higher conversion on newness, better engagement with capsule collections, and improved revenue per session compared to templated designs.
Developer Tools
For brands with technical teams, v20 opens the platform for extensibility without the burden of a custom build.
- Custom experiences at scale. With open APIs and SDKs, developers can integrate subscription flows, fit guides, or AR previews directly into the app. These differentiators keep customers in your ecosystem.
The KPI signal: more sessions driven by app-only features, higher revenue per session, and stronger differentiation against competitors.
- Safe, fast iteration. Sandbox environments and governance tools let teams test, learn, and roll out updates without risking production. Operators can experiment with more confidence than ever before.
The KPI signal: shorter iteration cycles, faster deployment of high-performing features, and more frequent measurable lifts tied to innovation.
Together, these four pillars expand the baseline. They give operators more control, clearer signals, sharper personalization, and extensibility without custom overhead. For leadership, the message is straightforward: the ceiling of app performance has been raised, and the teams who activate these levers are positioned to capture the upside with greater consistency.
9) The Bottom Line
We opened with a set of gates any serious revenue leader would apply to a new channel. Here are the answers, stated plainly and at the level a board expects:
1. Incrementality is proven. If this were merely an attribution shuffle, per-customer totals would be flat after adoption. They aren’t. When a web customer adopts the app, total spend per shopper rises ~36% in the Web→App cohort—even as some orders move out of the web. That lift is reinforced by the presence of an App-only cohort: receipts that do not exist in a web-only world and therefore cannot be waved away as “growth that would have happened.”
Viewed through cohorts rather than channels, the pattern is unambiguous: two surfaces produce more revenue than one, and you can see it at the customer level, not just on a blended dashboard.
2. Acquisition impact is real. Roughly one-in-eight customers begin in the app. That is not “download after three purchases”; it is the first receipt in the app. For that segment, the app is not a convenience layer—it is the entry point. If you don’t provide that surface, many of those customers will transact somewhere else. Bringing them in through the app also improves unit economics from day one: they start inside your lowest-cost engagement channel (push), with saved state and trusted payments, which shortens time to second order and raises the likelihood of habit formation in the first 2–3 purchases.
3. The floor is meaningful; the range is credible. Across versions 0–19, the platform-wide average lift is +21.13%, with most categories clustering in the +16–24% band. Floors near +10–12% still clear materiality at scale; for a $50M brand, that’s roughly $5M in incremental revenue. The distribution is why finance can underwrite this: use your category average as the baseline, recognize that disciplined execution moves you up the band, and treat outcomes below the average as execution risk—not proof the channel is speculative.
4. Timing isn’t neutral. Preference already exists; adoption compounds; reacquisition is expensive. Once a competitor earns a place on the home screen, they gain a zero-marginal-cost reach channel and a habit loop that’s hard to dislodge. A year’s delay doesn’t merely defer upside; it transfers future cash flows to someone else.
5. Execution explains variance. Brands at the high end don’t get there by accident. They make the value explicit (reasons to join like early access, capsules, loyalty unlocks), promote it everywhere (onsite, lifecycle, paid/creator, IRL QR), and keep the app alive (a programmed calendar plus high-signal triggers such as inventory and price).
What to do now:
- Model a three-case plan. Anchor your plan on the category average. Show a conservative case near the floor and a stretch case near the upper band. Convert each to dollars. You’ve just given finance a range grounded in evidence rather than aspiration.
- Assign ownership. Value placement (reasons to join), cross-channel promotion, and app programming each need an accountable owner. Put a shared calendar in the middle. If no one owns the calendar, the channel defaults to sporadic pushes—and outcomes fall back toward the floor.
- Publish a simple cohort dashboard monthly. Track four lines that actually govern this channel: app adoption rate, first-purchase-in-app share, per-shopper totals by cohort (before/after), and push-driven events with guardrails. Review it in the same meeting where you review topline revenue. When leadership sees these lines move, the debate ends and operating discipline begins.
- Commit to a 90-day ramp. In quarter one, stand up explicit reasons to join, instrument the cohorts, and ship a reliable cadence (drops/restocks/price moves) with deep links. In quarter two, layer early-access windows and loyalty habit loops. As the signal gets cleaner, increase frequency where it pays and retire what doesn’t. That is how compounding starts.
Do these things, and this channel stops being a hypothesis. It becomes an operating system: a way to convert preference into purchase, turn purchase into habit, and turn habit into durable lifetime value—deliberately, and at scale.
The evidence base is pre-v20; the upside from here is capability-driven. The biggest risk is not if an app will work for your brand, it’s waiting while competitors earn adoption first and compound it for free.
Make the call. Run the play. The data is strong, the mechanics are knowable, and the path to the high end of your range is now in your hands.
About the author

I manage all organic and paid social media initiatives at Tapcart, while also producing educational thought leadership content for Tapcart's ICPs across various marketing channels.
.avif)
.avif)


